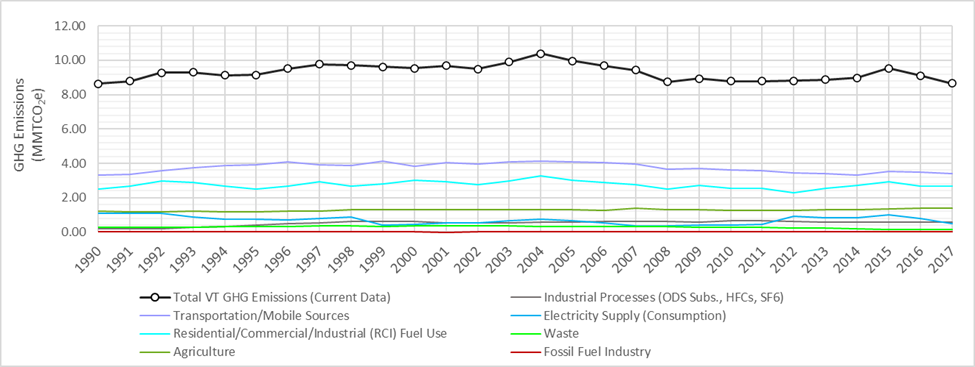
MONTPELIER – Today, the Vermont Department of Environmental Conservation (DEC) released the latest Greenhouse Gas (GHG) Emissions Inventory (1990-2017), which estimates the greenhouse gas emissions across different sectors of the Vermont economy. As in prior years, Vermont’s three largest sources of GHG emissions in 2017 were transportation, building energy use, and agriculture. As shown in Figure 1, Vermont GHG emissions declined 4.8 percent from 2016 to 2017 and returned close to 1990 baseline levels. The decline was driven primarily by reductions in electricity sector emissions, with a small reduction in transportation sector emissions. DEC also provided initial 2018 and 2019 estimates of GHG emissions that anticipate further overall emission declines due to continued reductions in the electricity sector.
DEC strives to use the best available models and data to estimate overall GHG emissions and updates them as needed to ensure the estimate are as accurate as possible. In preparing the 2017 Inventory, DEC determined a new approach was needed to estimate transportation-related emissions due to an unexplainable discrepancy in the model that has been used for several years. Specifically, from 2014 to 2017, the estimated vehicle miles traveled (VMT) by Vermonters increased by 365 million road miles (or 5%) yet the model estimated a 7% decline in transportation GHG emissions (see Figure 2). In seeking input and advice from the U.S. Environmental Protection Agency (USEPA), the reason for the confusing result could not be determined, nor did it match transportation emissions trends for other states in the region.
Based on the lack of confidence in this model output, DEC utilized another USEPA-approved methodology that uses actual fuel sales data to estimate transportation emissions in preparing the 2017 GHG Emissions Inventory. Several neighboring states, including Massachusetts, New Hampshire, and Maine, also use a fuel sales-based methodology for estimating transportation-related emissions. Further, Vermont uses a fuel sales-based methodology to estimate emissions from the building energy use sector.
The change in methodology has implications for Vermont’s overall emissions profile as transportation represents the largest single source of GHG emissions, and estimated transportation-related emissions are generally lower using the fuel sales-based methodology as compared to the VMT methodology. Whenever a change in methodology is made, it is applied to data from previous years as well to the extent possible, so the numbers can be compared (see Figure 2).
![]()
This change in methodology will be further reviewed by the Vermont Climate Council that was established by the Vermont Legislature in 2020. Specifically, the Climate Council is in the process of bringing on contracted support to perform a comprehensive review of Vermont’s GHG Emissions Inventory, and this will be a topic of review and continued discussion in order to ensure a transparent, consistent and accurate approach to estimating GHG emissions across all sectors.
Media Contact:
Elle O’Casey, Director of Communications
Agency of Natural Resources
elle.ocasey@vermont.gov | (802) 760-9967


ARTIFICIALLY REDUCING CO2//kWh TO MAKE HEAT PUMPS AND EVs LOOK EXTRA GOOD
http://www.windtaskforce.org/profiles/blogs/vermont-co2-reduction-of-evs-is-based-on-a-misrepresentation
ISO-NE uses fuel/energy fed to power plants to calculate CO2/kWh of the NE grid
Page 13 of URL shows 658 lb CO2/MWh, or 658 x 454/1000 = 299 g/kWh; fed to grid basis, or 323 g/kWh, fed to wall outlet basis.
https://www.iso-ne.com/static-assets/documents/2020/01/draft_2018_emissions_results_20200107.pdf
Imports were 17% of total electricity fed to the NE grid.
Assume imports have zero g CO2/kWh
Adjusted for imports 323/1.17 = 276 g/kWh, fed to wall outlet basis
ISO-NE calculated Vermont CO2 at 5.55 billion kWh x 276 g/kWh x 1 lb/454 g x 1 Mt/2204.62 lb = 1,530,426 Mt/y, fed to wall outlet basis, in 2018.
VT-DPS has its “proprietary way” of calculating CO2/kWh, based on PAPER power purchase agreements, PPAs, utilities have with owners of generating plants.
VT-DPS calculates Vermont CO2 at 190,000 Mt/y in 2018, based on PAPER PPAs, or 190000/1530426 x 276 = 34 g/kWh, fed to wall outlet basis, in 2018
VT-DPS and EAN uses the artificial 34 g/kWh to “evaluate” heat pumps and EVs, i.e., make heat pumps and EVs look extra good.
It is pure nonsense to talk of a “Vermont Energy mix”, or a “New Hampshire energy mix”, because electricity travels, as electromagnetic waves, at near the speed mpg light, i.e., 1800 mile in 0.01 second, i.e., from northern Maine too southern Florida in 0.01 second!!!
The electrons merely vibrate in place at 60 cycles per second.
78% Nitrogen
21% Oxygen
0.9% Argon
0.1% Everything else, including CO2 and cow flatulence.
But yeah, more taxes will fix that.