By Justin Bogie and Adam Michel | The Daily Signal
It’s nice to have more money in your pocket. And thanks to the 2017 tax cuts, the typical American is now paying less in taxes.
But that’s not to say we’re not still sending a hefty sum of money to Washington. Tally up all the payroll and other taxes on earnings and income, and you’ll find that the average American household forks over more than $26,000 to the feds each year. Last year, Washington collected more than $3.3 trillion in taxes. So where exactly does all that money go?
Some believe most of it goes to foreign aid and defense. Others think corporate subsidies dominate the budget.
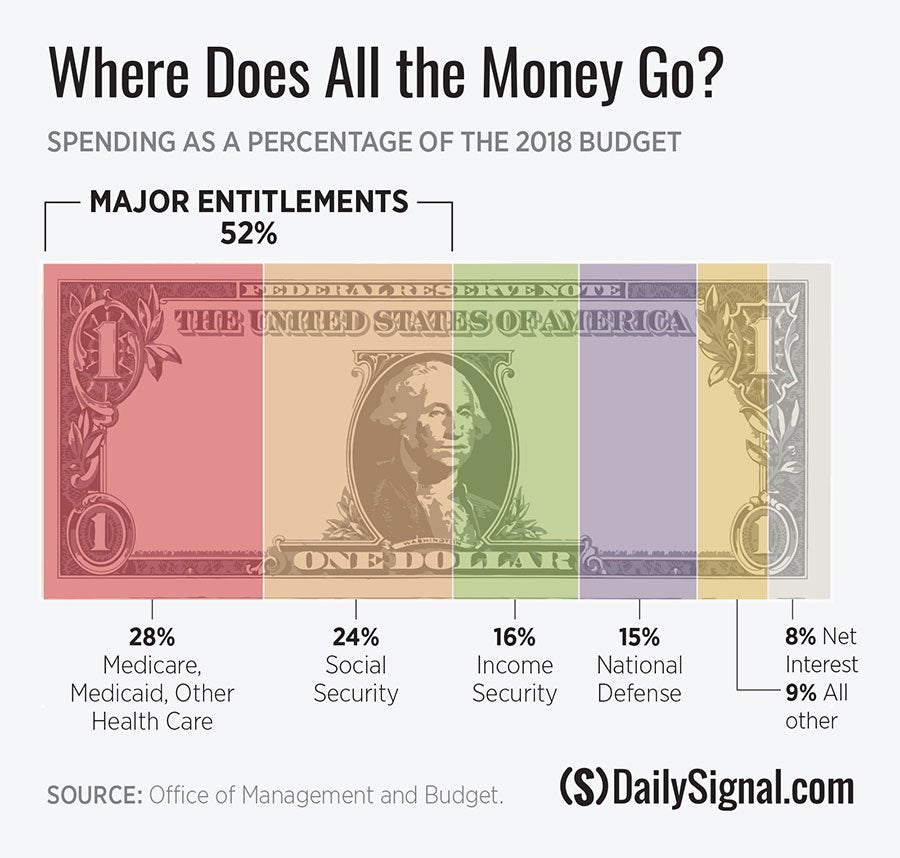
In reality, health entitlements—Medicare, Medicaid, Obamacare—and Social Security are the largest and fastest growing programs. Unless Congress fixes these four programs, they—and the ever-growing interest payments on the national debt—will consume every dollar of taxes paid by 2041. That leaves no money for anything else. Uncle Sam couldn’t spend a penny on defense, food assistance, highways, or education without driving the country further into debt.
Right now, Medicare, Medicaid, and Obamacare subsidies account for more than a quarter (28.8%) of all federal spending. Ten years from now, they’re projected to gobble up more than a third of the budget.
Meanwhile, Social Security, the single largest federal program, accounts for roughly a quarter of all federal spending all by itself. Its trust funds already pay out more than they take in, and its finances will only deteriorate faster as more and more boomers retire.
The Social Security trustees project that unless Congress implements much-needed reforms, the program will run out of reserve funds by 2034, potentially triggering a 23% cut in benefits.
Other income security programs—veterans’ benefits, food and housing assistance, federal employee retirement, and disability—account for 16% of the budget. That’s more than we spend on national defense. And the defense budget covers everything from military paychecks to operations overseas to the research, development, and acquisition of new technologies and equipment.
At 15% of the federal budget, defense spending is the last major category of federal spending. Most of what is left goes to people and corporations who hold Washington’s IOUs. Currently, 8% of the budget goes to interest payments on this debt.
Over the coming decade, U.S. debt held by the public is projected to balloon to nearly 93% of gross domestic product. But don’t blame that on “inadequate taxation.” By 2024, the pro-growth tax enacted in 2017 will actually raise more revenue yearly than the old system.
No, the culprit here is runaway spending, driven primarily by huge increases in health and Social Security outlays. And the long-term consequences of deficit spending are dire.
Economic growth tends to slow in countries with debts that are as big as their economy. The U.S. is quickly joining this group. As the debt increases, so does the cost of the interest we must pay to those who hold the debt. China is currently the largest foreign holder of U.S. debt.
Left unchecked, growing government spending and historically high levels of debt will ultimately require higher taxes—and just jacking up taxes on the rich won’t cut it. Paying for Big Government requires high taxes on middle-class Americans, too.
Eventually, rising debt will leave lawmakers with few options to avoid a financial crisis. Unless we can reverse course, it is only a matter of time before every American will be forced to pay higher income and payroll taxes.
On Tax Day 2019, be thankful for the extra money the 2017 tax cuts deposited in your pocket. But know that, unless we insist that lawmakers suppress their seemingly insatiable appetite to spend, we could all soon be paying much, much more.


This chart and article is a red hearing. Taxes for medicare and social security are paid directly by the employee and employer, and no one else. It has nothing to do with the debt. Take medicare and SS out of the chart and show us where the money is going for a accurate picture.
If you look at the chart it shows a dismal picture, just think when the Socialist DemocRATs
get the keys to the country ” Socialist Sanders ” spewing his Medicare for all, who in the
hell is going to pay for this boondoggle …….Oh yeah, raise the taxes, pretty simple.
Free is just a selling point….Wake up, People !!
A tidal wave of financial problems coming down the pike and all that the Democrats can focus on is getting Trump. No, they cannot walk and chew gum at the same time. They are so fixated on destroying Trump that they will allow this country to go completely down the drain while they go on their expensive and useless fishing expeditions.
Thank god Trump stopped them from going on a paid junket tour of the Mid-East on the taxpayer. A perk here, a perk there, insider trading it winds up being a Congress top heavy in all that financial over load on their shoulders, poor people.